What is Power BI and what is it used for?

The era of digital transformation and industry 4.0 has begun as we begin to mine the twenty-first century’s oil; data. Microsoft Power BI is a powerful tool that leverages large amounts of data to draw valuable insights, leading to data-driven decision making. Here, we’ll explore Power BI and how we’re putting it to work on our fluid bed automation solution, SmartX, in the remote working age.
What is Power BI used for?
Power BI is an easy-to-use business intelligence platform available for desktop or as a mobile application. Power BI is used to collect, collate, processes, and visualize data into dashboards from various sources that allow for easily accessible insights into all aspects of a business or process. These dashboards are designed for ease of sharing with the team.
Is Power BI difficult to learn?
Built on the foundation of Excel, Power BI is touted as among the most user-friendly of business intelligence software packages. Due to its reduced learning curve, users accustomed to using Excel adapt well to Power BI. However, users can expect far greater capability from Power BI, such as past, present and future trending and forecasting, enabled through built-in machine learning.
Microsoft has provided useful guides and resources on learning how to use Power BI here.
The Benefits of Power BI
- Built-in machine learning
- Reduced learning curve for users inexperienced with data analytics
- Easier to integrate into an organization due to widespread Microsoft 365 suite availability
Is Power BI similar to other platforms?
Although Power BI is similar to other analytics platforms, there are some differences:
- Power BI is considered user-friendly and suitable for users not experienced with data analytics
- Power BI does not handle large volumes of data as efficiently as other platforms. Power BI will not accept file sizes greater than 1GB without the use of Direct Query. Although this solution allows users to pull in larger datasets, it can lead to poor performance, and not all data sources support Direct Query
- Azure Data sources
- Power Platform Data Sources (Power BI Data sources, Power BI Dataflows)
- Power BI has more machine learning capabilities than many other platforms, such as the Quick Insights feature, as well as the ability to process natural language
- Some platforms can access more servers and databases than Power BI
- Power BI is often easier to integrate into an organisation due to the large volume of workspaces investing in the Microsoft 365 suite
Overall, Power BI is a cost-effective solution and often considered more useful for smaller organizations.
Can Power BI connect to multiple data sources?
Given that Power BI is a Microsoft product, it seamlessly integrates into a variety of MS product lines and suites, such as Office 365, Exchange, Dynamics 365, Excel and Teams. Third-party integration is available for Google Analytics, Salesforce, QuickBooks, and more, with further integration options becoming available, allowing users to connect and pull data from a diverse variety of data sources.
The highly customizable nature of Power BI grants users the ability to build personalized, custom visualizations and reports, as well as a range of advanced capabilities. These capabilities are achieved through its customer visualization SDK, founded on JavaScript libraries, or through custom software connectors. Power BI users can connect to multiple data sources easily, such as the following:
- Files (CSV, JSON, Excel)
- Databases (SQL, MySQL, Oracle)
- Azure Data sources
- Power Platform Data Sources (Power BI Data sources, Power BI Dataflows)
- Online Services (SharePoint Online List, Microsoft 365)
- Other (Web, custom connector)
How We’re Using Power BI For Fluid Bed Process Automation
In a new and rapidly advancing era of enterprise-level low code/no code, known as ‘hyper automation’, we chose Power BI as a proof-of-concept demonstrator for rapid and versatile distribution of powerful data visualization dashboards of our SmartX fluid bed process automation platform.
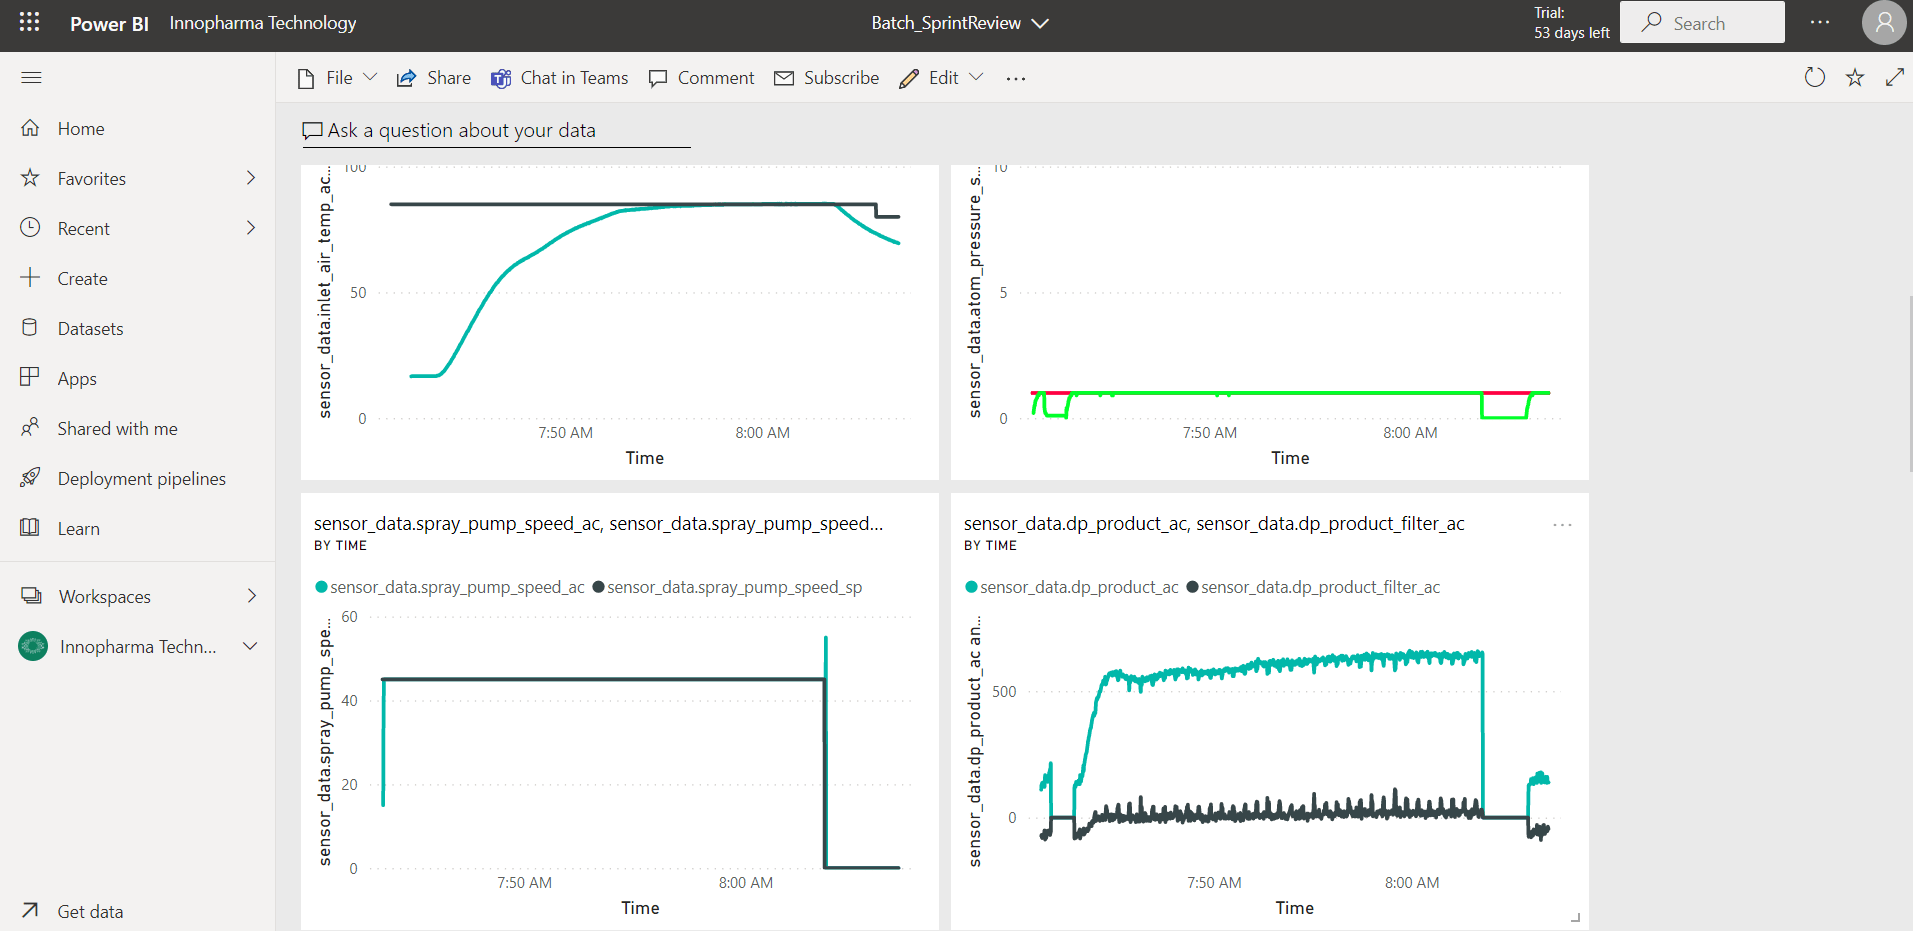
We developed a Power BI-to-SmartX cloud connector to directly access process data. The connector will transform and clean the data from SmartX to make it easier for users to build batch visualizations, see the image below. Once our Power BI connector is certified, it can be distributed by Microsoft.

Our exercise showcased the ease at which we can use third-party analytics and visualization software to interact with SmartX and empower the SmartX user to select their preferential technologies to interact with SmartX and derive maximum value.
With the COVID-19 crisis driving the transition to remote work, we continue to roll out a SmartX end-to-end hyperautomation feature set for process development, optimization and manufacturing.
For more information how we’re using Power BI for SmartX, get in touch!

